

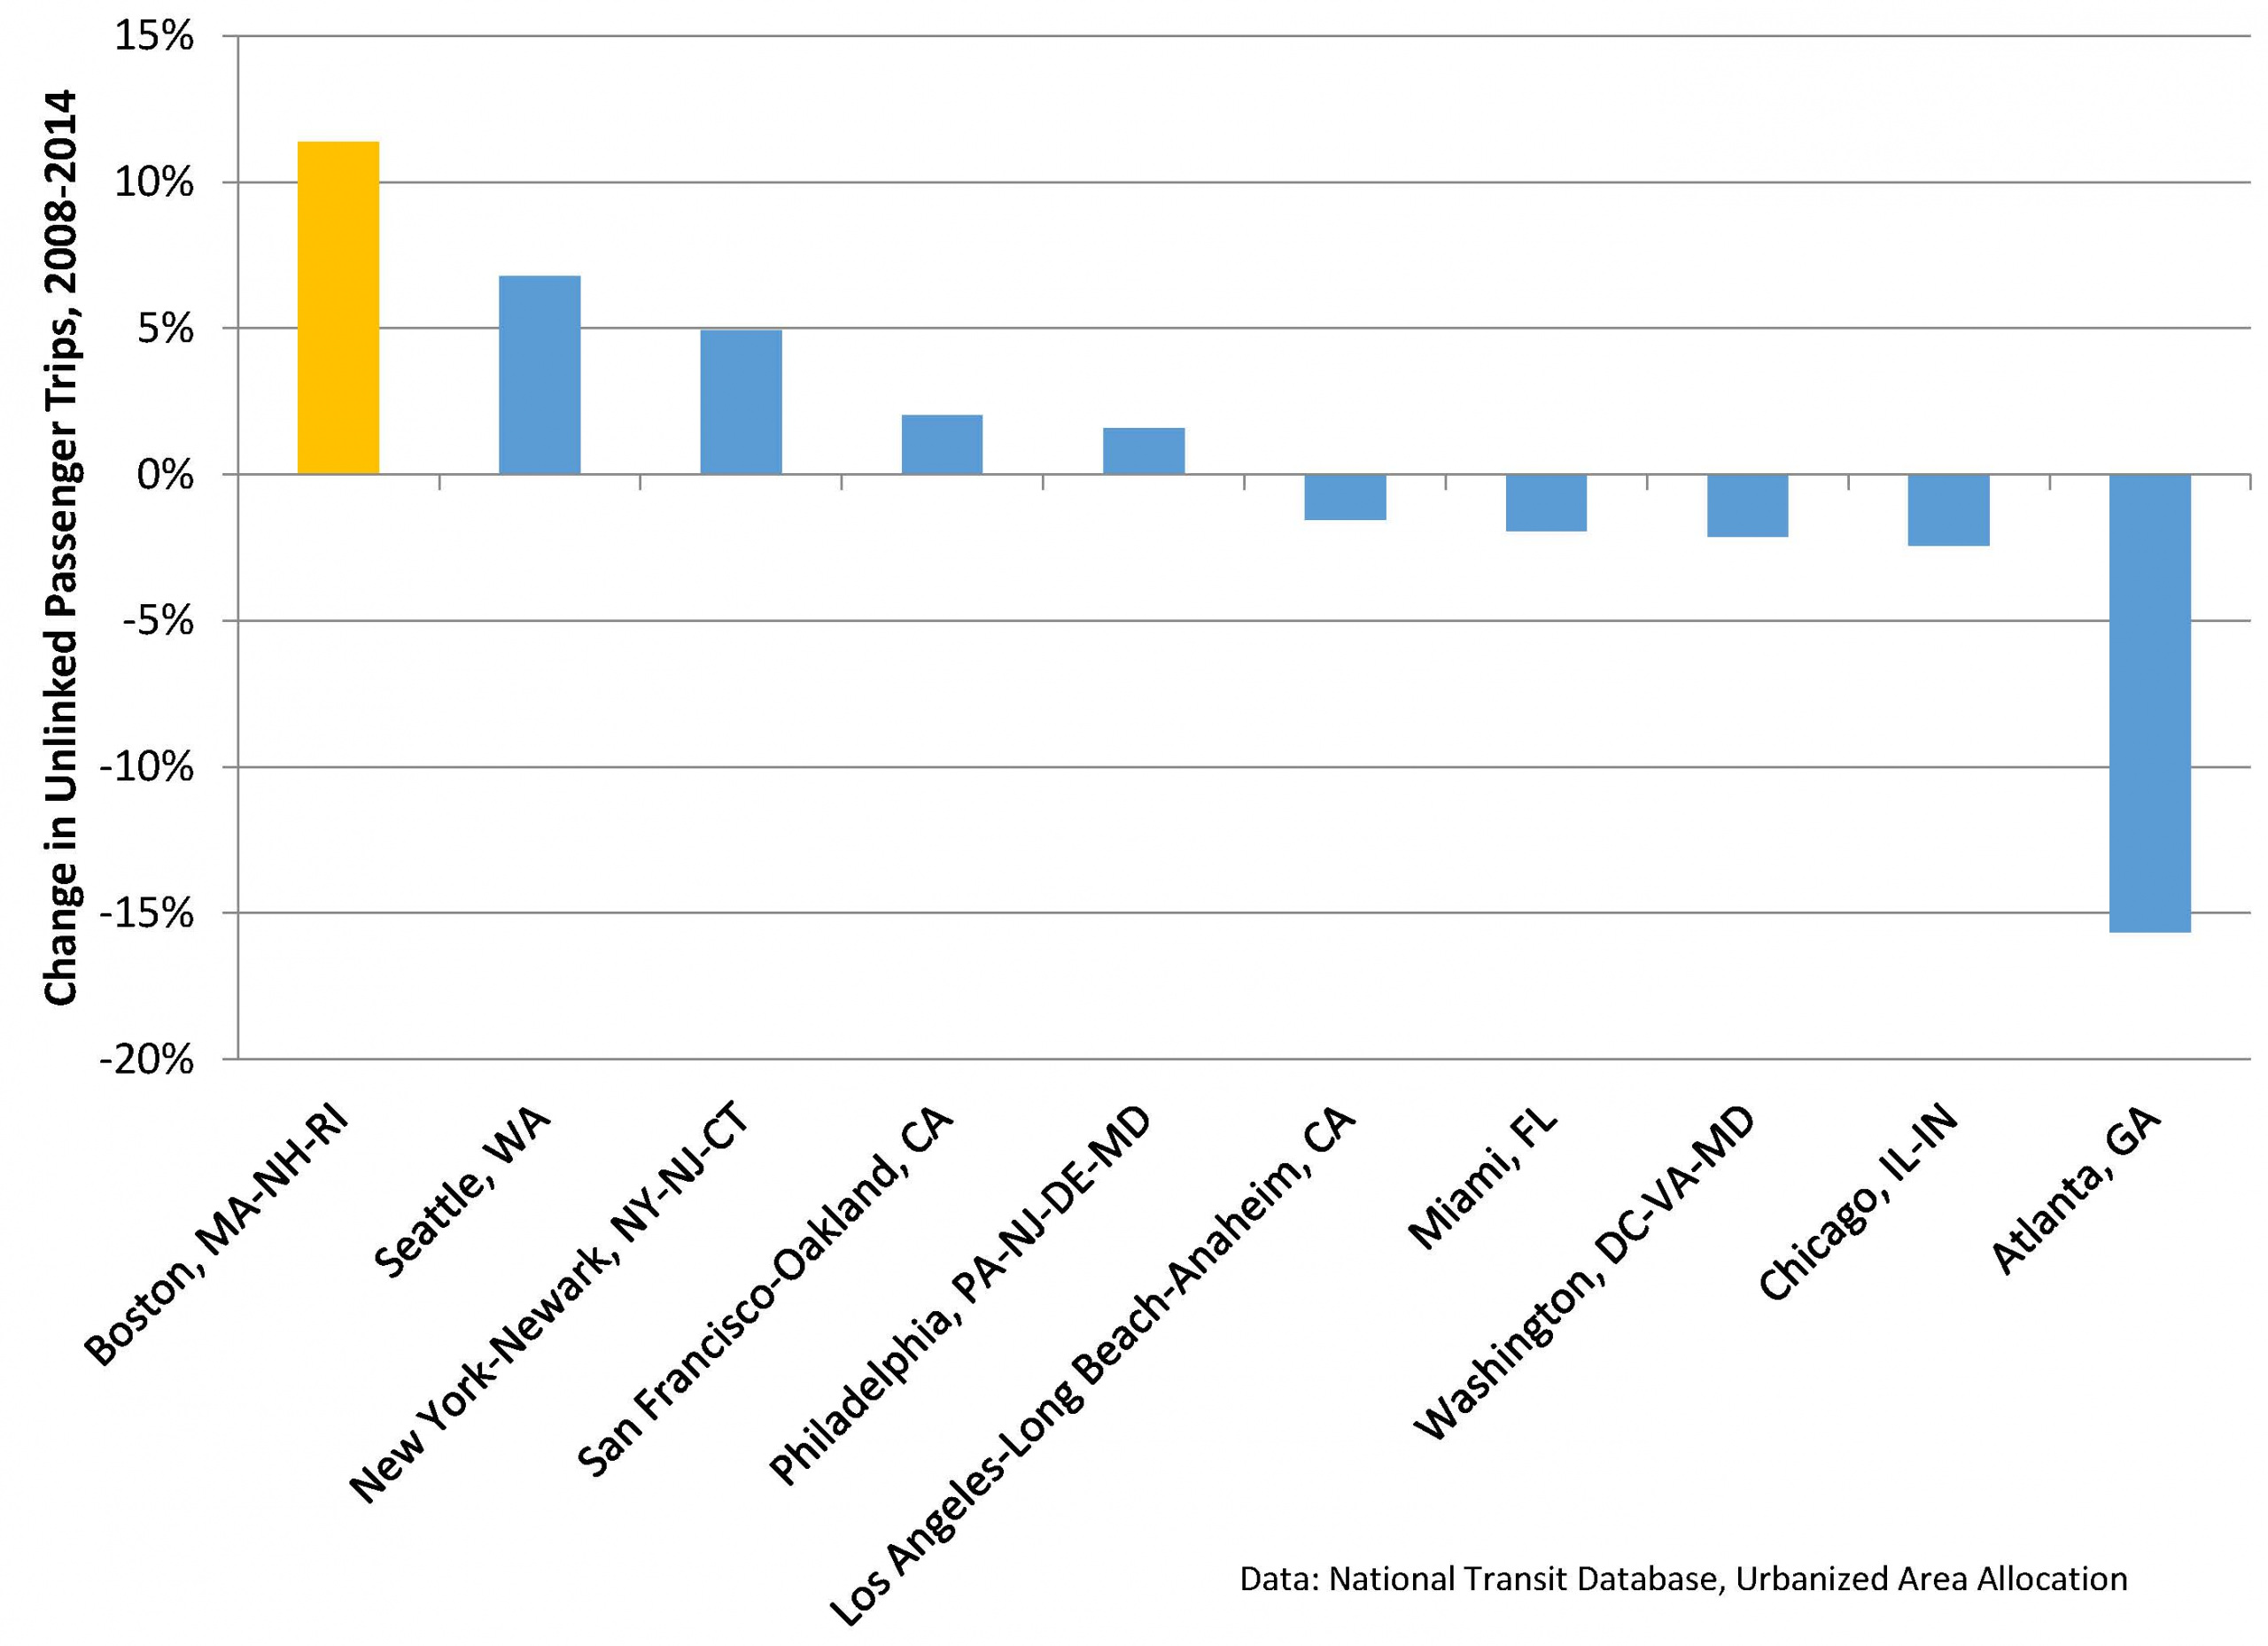
The number of transit trips taken in the Boston area increased by 11 percent between 2008 and 2014 – faster than that of any of the nation’s other top 10 transit cities.
Transit ridership grew faster in the Boston area between 2008 and 2014 than in any of America’s other top 10 transit cities. Since 2000, MBTA ridership has grown nearly twice as fast as the region’s population.[1] On some parts of the MBTA system – especially the subway – ridership growth has been even more rapid, resulting in crowding that often makes riding the T an unpleasant experience.
So it was surprising to see the MBTA’s Fiscal and Management Control Board (FMCB), in its annual report to the legislature (released just before the holidays) describe MBTA ridership as “basically flat.”
The FMCB has been tasked with getting to the bottom of the MBTA’s problems, and they’ve done an admirable job of bringing many of those problems to light. But for the FMCB to be effective, it has to be about more than squeezing every last penny out of the T; it also needs to lay the groundwork for developing a transit system that meets Greater Boston’s 21st century needs. That means figuring out how to meet the increasing demand for transit being driven by Boston’s rapid growth. The board’s misunderstanding of ridership trends is a worrying sign that it may be missing the forest for the trees.
*****
Not many people ride transit for fun. People ride because they need to get to or from work, school, shopping or a night on the town.
Since the Great Recession, the number of people who need to go places in Boston and surrounding urban communities has been increasing rapidly. According to the Census Bureau, the city of Boston added more than 40,000 new residents and more than 49,000 new jobs between 2008 and 2014.[2] Neighboring cities such as Cambridge have also seen growth. In percentage terms, Boston has added population faster since 2008 than at any other period since the early 20th century.
More people and more jobs are on the way. GE’s new headquarters in the Seaport district will bring 800 new jobs to the core, while the new development at the site of the Government Center garage will add more than 800 more housing units. Those are just the announcements that have been made since the new year began. Last year, the city of Boston issued the most residential building permits of any year since at least 1980, capping off several years of strong growth.
For many of those new residents and workers, the T is the best way – in some cases, the only practical way – to get around. So it should be no surprise that MBTA ridership has risen in recent years.
Rising ridership is a good thing – enabling the region to support more growth and activity without the downsides of increased traffic congestion and pollution. Increasing ridership also pumps more revenue into the system, even if it also imposes some additional costs (e.g., crowding).
It is curious that the FMCB, which often benchmarks the T against other agencies, didn’t compare ridership trends with systems in other cities. Making a valid comparison isn’t easy; as we’ve written before, the MBTA is an unusual agency in that it is the dominant provider of transit service throughout our region, whereas other cities have a multitude of transit providers, each focused on a specific service. (The San Francisco Bay region, for example, is served by 27 separate transit agencies.)
Fortunately, the National Transit Database provides us with a tool to compare transit ridership across all services within a given urban area. By that measure, the number of transit trips taken in the Boston area increased by 11 percent between 2008 and 2014 – faster than that of any of the nation’s other top 10 transit cities.[3] In absolute terms, Boston saw the addition of nearly 43 million transit trips during this period, second only to the New York area.
Figure: Change in Transit Ridership by Urban Area, Top 10 Transit Cities
The growth in ridership has not been spread evenly across all modes. Modes that primarily serve the urban core (subway and bus) have seen faster ridership growth – with heavy rail subway ridership up 5.8% in 2014 alone – while official statistics on commuter rail ridership (which are deeply unreliable) show that it has fallen in recent years.
It is safe to say, however, that the T has not been attracting lots of new riders by sheer force of its awesomeness. In fact, rising fares and deteriorating service are likely driving some new residents and workers who would otherwise ride the T to bike, Uber, carshare, drive, or Bridj instead. If the MBTA better connected new nodes of growth in the city, and did it more reliably, comfortably and affordably, you can bet that even more people would ride. The market is there.
Largely because of the T, Boston has avoided a massive increase in congestion amid its recent growth – only 7,000 of the more than 49,000 new workers commuting to jobs in Boston since 2008 get to work in a car. And the T will be even more important as the region grows as lower-income residents increasingly face the choice between expensive housing in the city and transit-inaccessible housing in the suburbs, as development spreads from the downtown core to new neighborhoods, and as the demographics and needs of the region shift.
The debate about the future of the T cannot be divorced from the larger discussion about how Massachusetts can get the greatest benefit from new growth, while minimizing its costs to our pocketbooks, the environment and our quality of life. The MBTA – until last winter, anyway – was a transit system experiencing rapid ridership growth in a rapidly growing city. Fixing the T is critical, but if Greater Boston is to meet the challenges and take advantage of the opportunities of the 21st century, just fixing the T is not going to be enough.
[1] The population of the Boston metropolitan statistical area increased from 4.4 million in 2000 to 4.7 million in 2014, for a gain of 7.8%. MBTA ridership increased by 15%.
[2] American Community Survey 1-year data.
[3] Top 10 as measured by 2014 ridership, from National Transit Database.
Associate Director and Senior Policy Analyst, Frontier Group
Tony Dutzik is associate director and senior policy analyst with Frontier Group. His research and ideas on climate, energy and transportation policy have helped shape public policy debates across the U.S., and have earned coverage in media outlets from the New York Times to National Public Radio. A former journalist, Tony lives and works in Boston.