

When one makes fair, apples-to-apples comparisons of the MBTA’s service growth and spending patterns with those of other large transit agencies, the T appears to be quite normal.
On Monday, the Pioneer Institute posted another in a series of misleading pieces about the MBTA and its finances – this time, a comparison of capital expenditures at the MBTA versus other leading transit agencies that purports to show that the notion of an underfunded MBTA is a “myth.”
The institute’s latest post continues a recent trend of comparing the MBTA with transit agencies that offer very different mixes of transit services, leading to inappropriate conclusions. It ignores common measures of transit use that produce dramatically different results. And it fails to take the trouble of doing true apples-to-apples comparisons that might actually yield useful information – or at least point the way to useful questions.
In short, the comparisons made by Pioneer don’t tell us anything of value about whether the MBTA is underfunded, overfunded, or properly funded. They are a distraction that impedes decision-makers and the public from getting to the important issues and concerns that should be at the heart of the debate over the T’s future.
****
Not all transit agencies are alike. Some transit agencies run only local bus or rail service – think of them as oranges. Others run only commuter rail service – think of them as apples. Some serve only core cities, while others cover entire regions.
The MBTA is one of a very few transit agencies in the United States that provides a full range of transit services – light rail, subway, commuter rail, bus, ferry, etc. – at both a local and regional scale. It is a fruit salad.
Comparing apples to fruit salads creates all sorts of opportunities for misunderstanding, misinterpretation and mischief. Pioneer’s post is an example.
To peer under the hood of Pioneer’s data, I first attempted to replicate the institute’s figures for capital expenditures per passenger-mile, which I was largely able to do using 1992-2013 data from the National Transit Database. Indeed, if one compares the agencies Pioneer studied[1] on that measure, the MBTA does come out on top.
But the story doesn’t end there. If one evaluates the MBTA’s capital expenditures against another common measure of transit use – the number of passenger trips taken – a very different picture emerges, with the MBTA toward the middle of the pack among the same group of agencies. (See chart below.)
Capital Expenditures (1992-2013) per 100,000 Unlinked Passenger Trips (data from National Transit Database)
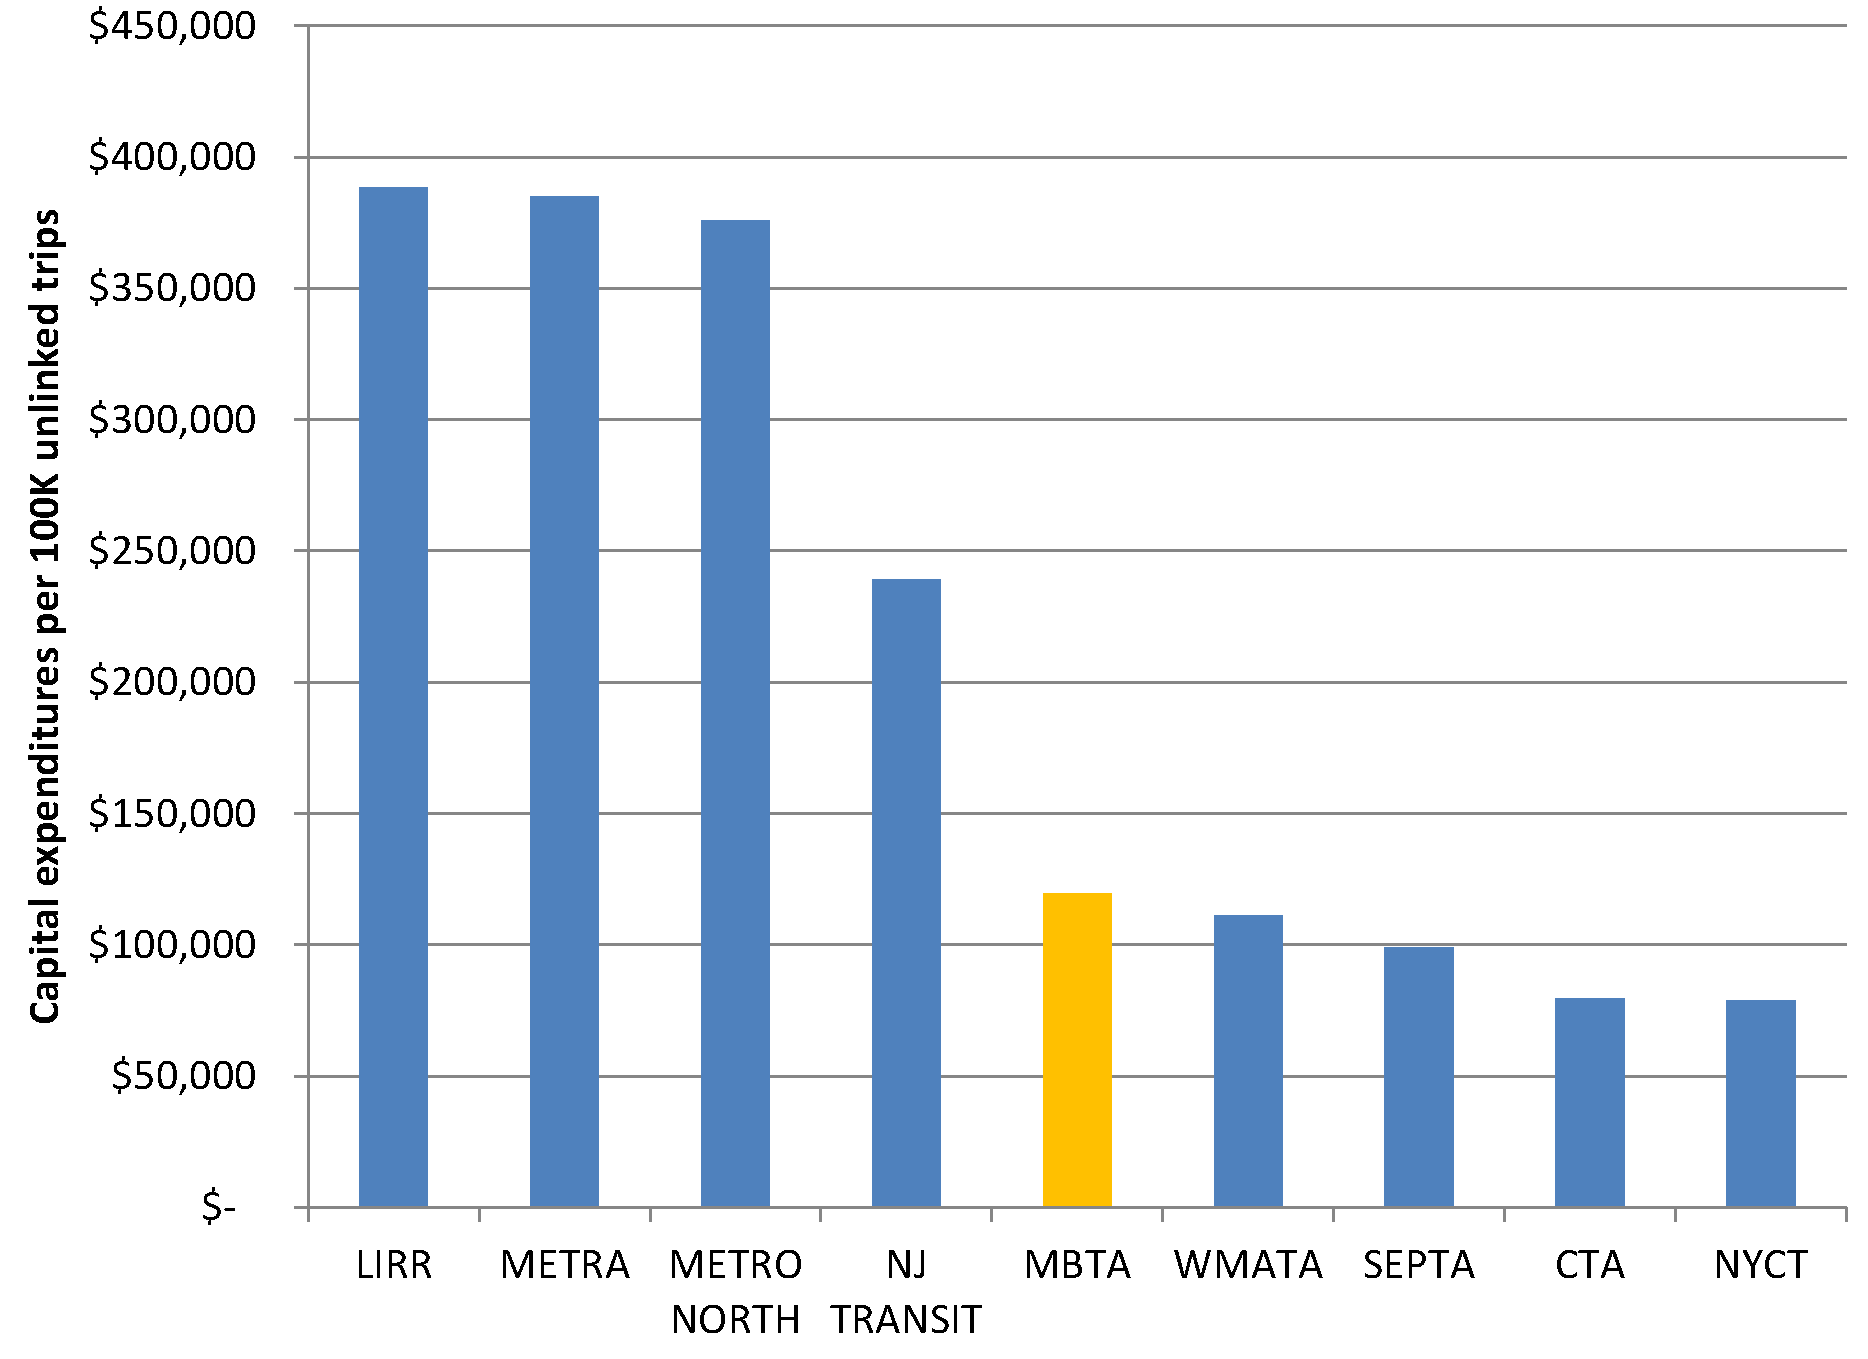
In the chart above, the MBTA spends less per trip on capital expenditures than all of the studied agencies that provide only commuter rail. It spends more per trip than all of the agencies that provide only local bus or rail service. And it falls in between the two other “fruit salad” agencies in this sample – NJ Transit (which is commuter rail-heavy) and the Philadelphia area’s SEPTA.
The Pioneer Institute jumps to the conclusion that it is the numerator – the amount of spending – that matters most in its analysis. But, as the example above shows, the denominator – the amount and type of transit service provided by these agencies – matters a great deal as well. Failing to account for differences in the services offered by varying agencies can easily lead to skewed results and faulty conclusions.
Comparing a commuter rail-only system with a local bus and subway system is like comparing a state highway department with a city public works department charged with building and maintaining local streets. Even if the cost of labor, materials and other expenses are the same for the two agencies – and there are legitimate reasons why they might not be – the roads those agencies manage perform such dramatically different functions that any comparison of capital spending based on how the roads are used is likely to lead us astray.
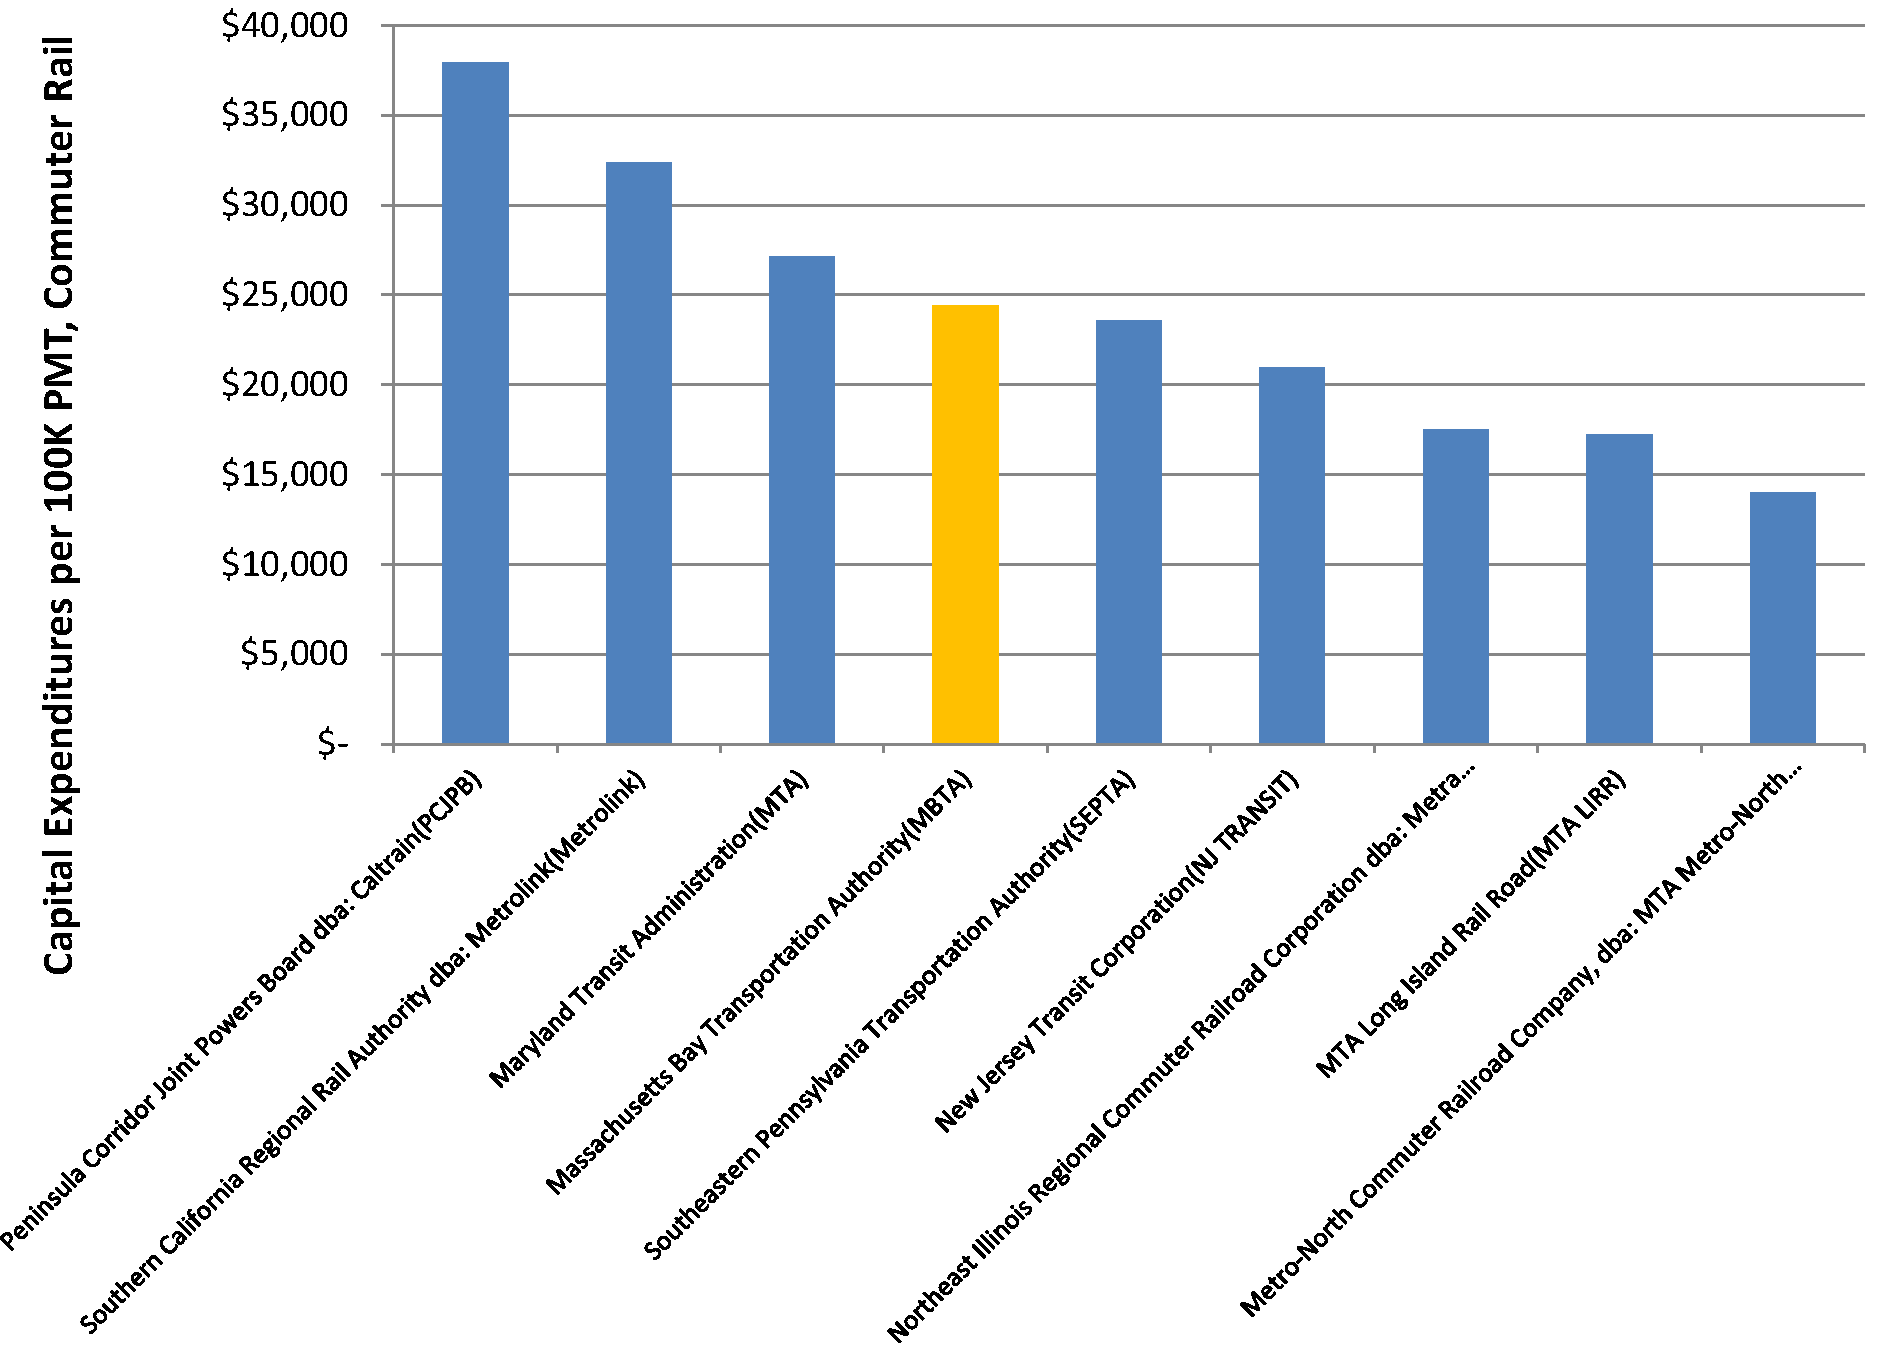
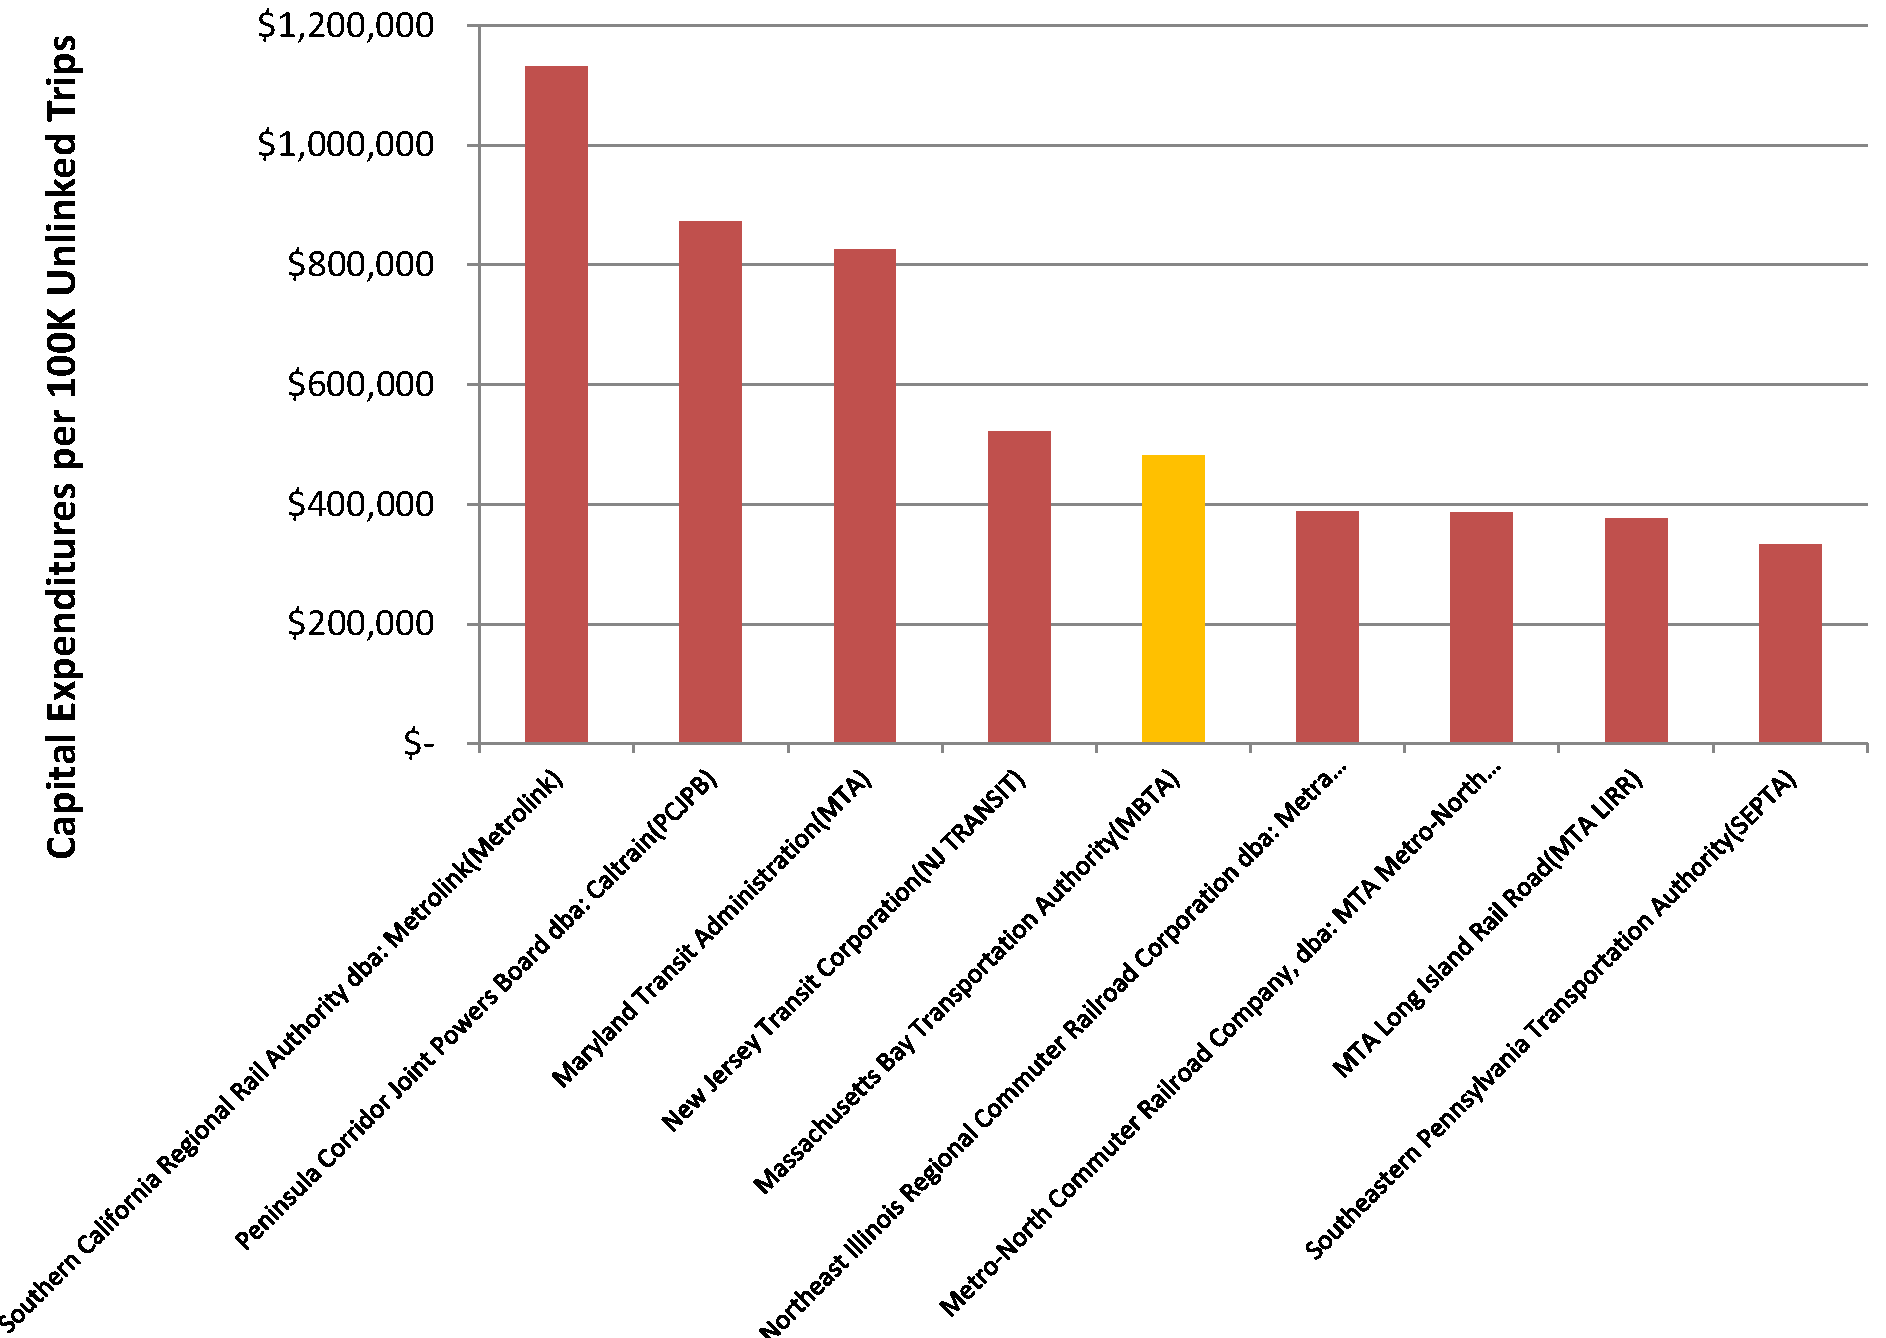
A much better approach is to compare agencies based on their provision of specific services, such as commuter rail.[2] If one does so for commuter rail, based on the “major” commuter rail agencies defined by Pioneer, the MBTA’s capital expenditures per passenger-mile and passenger trip wind up right where the T seems to land in any fair and complete comparison with other agencies: squarely in the middle of the pack. The two charts below compare capital expenditures on commuter rail with passenger-miles traveled and passenger trips from 1992 to 2013.
Capital Expenditures per 100,000 Passenger-Miles Traveled, 1992-2013, Commuter Rail Only
Capital Expenditures per 100,000 Unlinked Passenger Trips, 1992-2013, Commuter Rail Only
None of this is to say that there aren’t real and important differences in capital spending between the MBTA and other agencies. Smart analysis of transit agency financial and service data can help lead us to the right questions. But the measures used by Pioneer cannot tell us that the MBTA is spending more than other agencies that provide similar services in similar circumstances – and they certainly can’t tell us whether the MBTA is being funded adequately to meet the region’s transportation needs.
As we documented in our debunking of Pioneer’s claim that the MBTA is the nation’s fastest-growing transit agency (to which we will have a follow-up soon), and as the Globe’s David Scharfenberg reported in his analysis of the MBTA’s operating costs, when one makes fair, apples-to-apples comparisons of the MBTA’s service growth and spending patterns with those of other large transit agencies, the T appears to be unexceptional. It has expanded faster than some other agencies and slower than others. It spends more than some agencies and less than others.
To acknowledge that fact is not to excuse the agency’s missteps, nor is it to absolve the agency of the responsibility for being better than normal – we should all demand smart decisions and exceptional performance, not just mediocrity. But we need to get beyond simplistic, overdrawn apples-and-oranges comparisons in order to have the better, richer and more productive discussion of the MBTA, its future, and the future of public transportation that Massachusetts residents deserve.
[1] The choice of agencies for comparison is key. In this post, we focus on Pioneer’s analysis of total capital expenditure per passenger-mile. But, the institute’s comparison in the same post of capital spending per vehicle revenue-hour uses a different set of agencies than the analysis by passenger-mile, excluding commuter rail-only agencies entirely. All of the apples, in other words, have been removed. If the same agencies had been included in Pioneer’s vehicle revenue-hour analysis as were included in the passenger-mile analysis, the T’s relative level of capital spending would have fallen well below those of commuter rail-only agencies such as the Long Island Rail Road and Metro-North railroad.
[2] Even comparisons between agencies within a mode, however, may mask important differences in how those modes operate in different cities. For example, the average trip on SEPTA’s commuter rail network is less than half as long as the average trip on the LA area’s commuter rail network, suggesting that it serves a greater variety of local trips.
Associate Director and Senior Policy Analyst, Frontier Group
Tony Dutzik is associate director and senior policy analyst with Frontier Group. His research and ideas on climate, energy and transportation policy have helped shape public policy debates across the U.S., and have earned coverage in media outlets from the New York Times to National Public Radio. A former journalist, Tony lives and works in Boston.