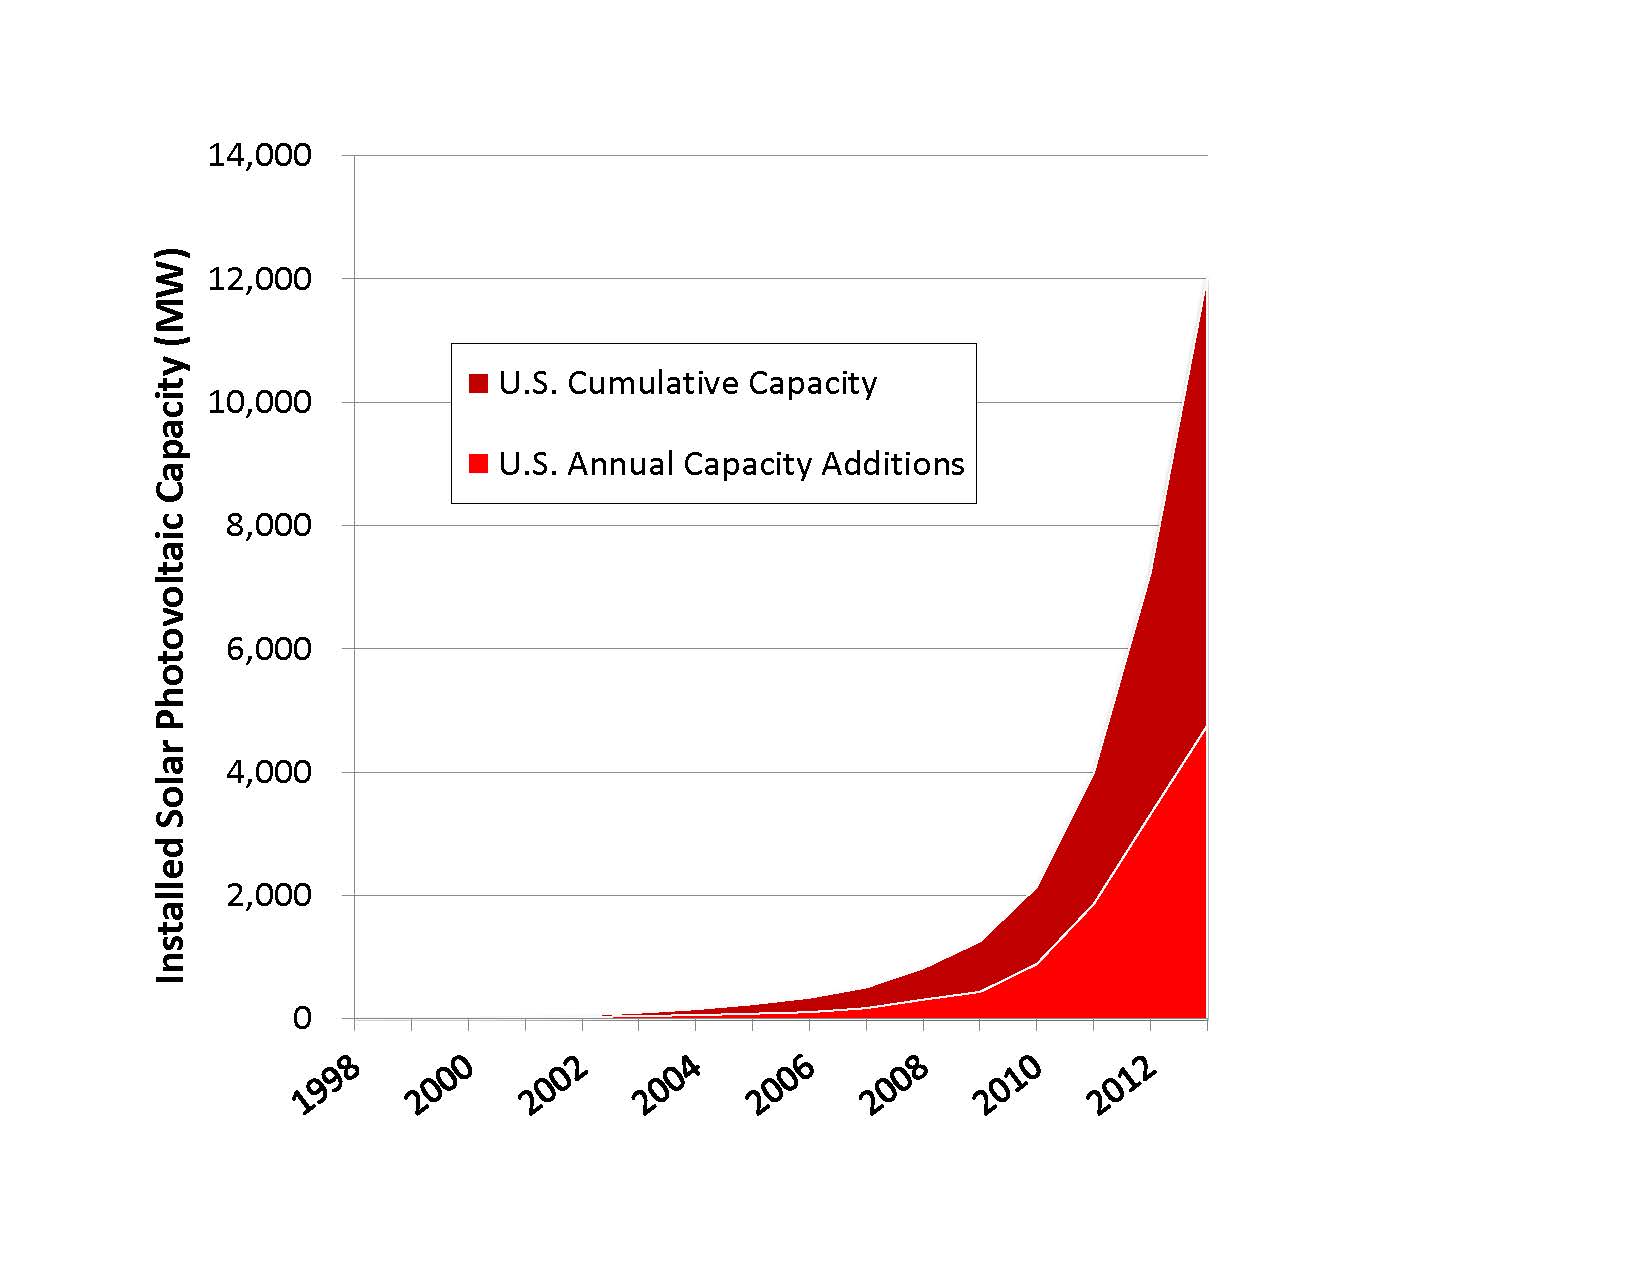
Solar energy is on the rise. Over the course of the last decade, the amount of solar photovoltaic (PV) capacity in the United States has increased more than 120-fold, from 97 megawatts in 2003 to more than 12,000 megawatts at the end of 2013. In the first quarter of 2014, solar energy accounted for 74 percent of all the new electric generation capacity installed in the United States. The cost of solar energy is declining, and each year tens of thousands more Americans begin to reap the benefits of clean energy from the sun, including energy generated right on the rooftops of their homes or places of business.
America’s solar energy revolution has been led by 10 states that have the greatest amount of solar energy capacity installed per capita. These 10 states have opened the door for solar energy and are reaping the rewards as a result.
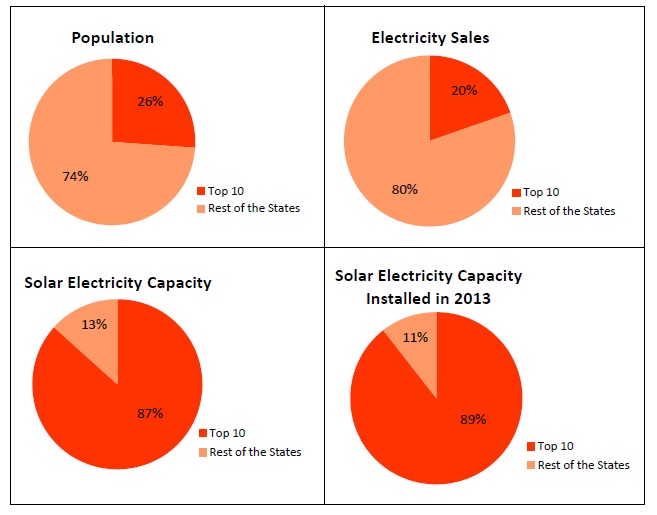
The Top 10 states with the most solar electricity installed per capita account for only 26 percent of the U.S. population but 87 percent of the nation’s total installed solar electricity capacity.* These 10 states – Arizona, California, Colorado, Delaware, Hawaii, Massachusetts, Nevada, New Jersey, New Mexico and North Carolina – possess strong policies that are enabling increasing numbers of homeowners, businesses, communities and utilities to “go solar.”
Other rising stars include New York, Vermont and Georgia, which have large or fast-growing solar energy markets and strong new solar policies or programs implemented since mid-2013.
Unfortunately, the success of solar power in these and other states has been threatened by recent attacks by fossil fuel interests and electric utilities on key solar policies, such as net metering. Despite those attacks, many states have reaffirmed and expanded their commitments to solar energy over the past year by increasing solar energy goals and implementing new policies to expand access to clean solar power.
By following the lead of these states, the United States can work toward getting at least 10 percent of our energy from the sun by 2030, resulting in cleaner air, more local jobs and reduced emissions of pollutants that cause global warming.
Figure ES-1. Cumulative U.S. Grid-Connected Solar Photovoltaic Capacity
Figure ES-2, a-d. Solar Energy in the Top 10 Solar States versus the Rest of the U.S.
Solar energy is good for the environment, consumers and the economy.
- Solar photovoltaics (PV) produce 96 percent less global warming pollution per unit of energy than coal-fired power plants over their entire life cycle, and 91 percent less global warming pollution than natural gas-fired power plants.
- Solar energy benefits consumers by reducing the need for expensive investments in long-distance transmission lines.
- Solar energy can lower electricity costs by providing power at times of peak local demand.
- The cost of installed solar energy systems has fallen by 60 percent since the beginning of 2011.
- Solar energy creates local clean energy jobs that can’t be outsourced. More than 140,000 people currently work in America’s solar energy industry, about half of them in jobs such as installation that are located in close proximity to the places where solar panels are installed.
Solar energy is on the rise – especially in states that have adopted strong public policies to encourage solar power.
- The amount of solar photovoltaic capacity* in the United States has tripled in the past two years. (See Figure ES-1.)
- America’s solar energy revolution is being led by 10 states which have the highest per-capita solar electricity capacity* in the nation. These 10 states – Arizona, California, Colorado, Delaware, Hawaii, Massachusetts, Nevada, New Jersey, New Mexico and North Carolina – account for 26 percent of the U.S. population and 20 percent of U.S. electricity consumption, but 87 percent of total U.S. solar electricity capacity and 89 percent of the solar electricity capacity installed in 2013. (See Figure ES-2 and Table ES-1.)
Table ES-1. Solar Electricity Capacity in the Top 10 Solar States (ranked by cumulative capacity per resident; data from the Solar Energy Industries Association)
- From 2012 to 2013, Arizona maintained its first-place ranking as the state with the largest amount of solar energy capacity per capita, with 275 Watts/person at the end of 2013. California and Massachusetts both advanced two spots in the rankings to fourth place and eighth place, respectively, significantly increasing their per-capita installed solar energy capacity. North Carolina continued its aggressive build-out of utility-scale solar energy, growing its per-capita capacity by more than 140 percent since 2012.
America’s leading solar states have adopted strong policies to encourage homeowners and businesses to “go solar.” Among the Top 10 states:
- Nine have strong net metering policies. In nearly all of the leading states, consumers are compensated at the full retail rate for the excess electricity they supply to the grid.
- Nine have strong statewide interconnection policies. Good interconnection policies reduce the time and hassle required for individuals and companies to connect solar energy systems to the grid.
- All have renewable electricity standards that set minimum requirements for the share of a utility’s electricity that must come from renewable sources, and eight of them have solar carve-outs that set specific targets for solar or other forms of clean, distributed electricity.
- Nine allow for creative financing options such as third-party power purchase agreements, and eight allow Property Assessed Clean Energy (PACE) financing.
- States in the Top 10 are far more likely to have each of these key solar policies in place than other states, reinforcing the conclusion of U.S. Department of Energy research linking the presence of key solar policies to increases in solar energy deployment.
Beyond the Top 10 states for per-capita solar energy capacity, there are several “advancing” states that have accelerated growth of their solar energy markets by embracing solar-friendly policies.
- With 250 MW of solar electricity capacity installed at the end of 2013, New York ranks ninth in the nation for cumulative solar energy capacity. New York recently expanded its commitment to solar energy by investing an additional $1 billion in its highly successful NY-Sun Initiative and extending the program through 2023. The state has also developed an innovative, market-based structure for solar energy incentives that will provide long-term funding certainty for solar energy developers.
- Vermont ranked eighth for per-capita solar energy capacity installed during 2013. Though Vermont is the only state in the Northeast not to have a renewable portfolio standard, it has many other strong policies that drive solar energy development. The state continued its track record of solar energy leadership in 2013 by raising its net metering cap from four percent of a utility’s peak load to 15 percent.
- Georgia’s per-capita solar energy capacity took a dramatic leap forward in 2013 after the state Public Service Commission voted to require the state’s largest utility to construct or procure 525 MW of solar energy capacity by the end of 2016. The state added 9 W per person in 2013 – more than eight times as much as it added in 2012.
Strong public policies at every level of government can help unlock America’s potential for clean solar energy. To achieve America’s full solar potential:
- Local governments should adopt policies guaranteeing homeowners and businesses the right to use or sell power from the sunlight that strikes their properties. They should also implement financing programs, such as property-assessed clean energy (PACE) financing, adopt bulk purchasing programs for solar installations, and adopt solar-friendly zoning and permitting rules to make it easier and cheaper for residents and businesses to “go solar.” Municipally-owned utilities should promote solar by providing net-metering, Value of Solar rates, and by making investments in community-scale and utility-scale solar projects.
- State governments should set ambitious goals for solar energy and adopt policies – including many of those described in this report – to meet them. State governments should also use their role as the primary regulators of electric utilities to encourage utility investments in solar energy, implement rate structures that maximize the benefits of solar energy to consumers, and support smart investments to move toward a more intelligent electric grid in which distributed sources of energy such as solar power play a larger role.
- The federal government should continue key tax credits for solar energy, encourage responsible development of prime solar resources on public lands in the American West, and support research, development and deployment efforts designed to reduce the cost of solar energy and smooth the incorporation of large amounts of solar energy into the electric grid.
- All levels of government should lead by example by installing solar energy technologies on all government buildings.
* In this report, “solar photovoltaic capacity” refers to installed solar photovoltaic systems, both distributed and utility-scale. “Solar electricity capacity” refers to all solar technologies that generate electricity, including concentrating solar power systems that use the sun’s heat – rather than its light – to generate electricity. The figures in this report do not include other solar energy technologies, such as solar water heating.